Your campaign can be a part of the most effective programmatic ads strategy with the best creatives and targeting features, but all this will have no real value if your ads aren’t viewed. There can be many reasons why an ad doesn’t get exposure, so it is important for marketers to make sure that all their purchased impressions get desired attention. To understand how many of their ads are actually seen by real users, ad viewability measurement was introduced. In this blog post, we are going to explore what is viewability and how this metric can help advertisers.
What is ad viewability?
Advertising viewability is a metric of digital advertising used by marketers to measure how many of their ads get real exposure to users. Such numbers can give advertisers a clear picture of their viewable ads and, therefore, help to understand how much real value their campaign will add to their overall strategy.
Why should you care about viewability advertising?
In 2013, an in-depth analysis of thousands of ad campaigns from comScore revealed that 54% of all display advertising impressions have never been seen by users. The next year, this information was confirmed by Google - 56.1% of display impressions from DoubleClick and other Google’s ad platforms are not viewable. The news shook the industry, so both publishers and advertisers started to raise awareness around viewability metrics. Thanks to this, the situation changed for better - in 2019 global viewability averages surpassed 60%, according to the IAS report. Yet, this still means that almost 40% of your ads aren’t even seen by an actual human, so there still a way to go:
- Distinguish real views. By measuring ad viewability you can make sure that your ad was viewed by real humans, in contrast to bots, web crawlers, or various kinds of fraudsters.
- Find the best place for your ads. Your creatives can be located within the content, on the sidebar, or elsewhere around the page, but where would they get the most users’ attention? Measuring viewability is a good strategy to find out these ‘hot spots‘ and make the campaigns much more effective.
- Understand your audience better. Viewability can also be used to get some insights into your ads. Which features get more viewership and drive more engagement? Understanding these factors can help you get a better understanding of your potential customers and how they interact with your ads.
- Stop wasting the ad budget. With such metrics as viewability, advertising campaigns can become much more cost-effective. Tracking this metric will reveal which of your ads are not seen. Thus, it will give you an opportunity to improve the situation and save your advertising campaign budget.
With all that in mind, let us now dive deeper into the details of how to measure ad viewability.
What is a viewable impression?
Now that we got a viewability definition, it is time to explore what are viewable impressions. To get a precise vision of digital advertising viewability let’s check current industry standards:
- For small display ads (e.g. banners sized 300*250 or 728*90 px) - ads would be considered viewable if they have at least 50% of pixels loaded and viewed by a real visitor for at least one continuous second;
- For larger display ads (e.g. billboards sized 970*250 or 300*1050 px) - an ad should be counted as viewable if 30% is loaded and viewed for at least one second;
- For desktop video ads - at least 50% of an ad should be loaded. It should catch visitor’s attention for at least two seconds;
What is mobile ad viewability?
This all can work well for display ads, but how to measure ad viewability when it comes to mobile formats? According to the Media Rating Council (MRC) viewability guidelines, in order to count as viewable a mobile ad impression should meet the following criteria:
- 50% or more of the pixels are viewable on the device for at least one continuous second;
- Video ads should also have at least 50% of pixels in view for at least 2 continuous seconds.
How to measure ad viewability?
Now that we discussed viewability and why it is so important for advertisers it is time to turn to practice and explore how to measure ad viewability.
The ad viewability rate is one of the most common viewability metrics. Typically it can be calculated as a percentage of viewable impressions compared to the total number of served impressions within the advertising campaign. In order to calculate the viewability rate you can use the following formula:

Total viewable ad impressions: the number of ads that were successfully delivered, with at least 50% pixels loaded and which stayed in a user’s view for a minimum of 1 second or longer (2 seconds for video ads).
Total served ad impressions: the number of ads that were successfully delivered on the web page by an ad server. Example: you get 300,000 overall served impressions with only 250,000 being viewed. In this case, your viewability rate will be 83.33%. It implies that the remaining 50,000 (16.67%) of impressions you’ve paid for never entered a user’s viewable area. So, the higher the ad visibility rate is, the better.
How does ad viewability work?
To measure digital ad viewability a special feature should be embedded in the ad creative. Usually, a javascript tag is attached to the ad and it is then activated once an ad is loaded in front of the user. This tag is in essence an advertising viewability tracker that launches automatically in the user’s browser.
Such a tracker gathers various information about the interaction and the environment. This data can include browser window dimension, ad positioning on the page, view time, the scroll position at the time an ad was served, and other parameters. It is then reported and sent back to the database at the server-side.
What are the main causes of poor ad viewability?
There are many reasons why so many of the ads aren’t viewable. Some are rooted within the website design and ad placement, while others are more related to user behavior and technologies (i.e. connection type and speed, device, screen size, etc). Some of the most common scenarios for low-viewability ads campaign include:
- An ad blocker is on. There are myriads of browser plugins and filters available that prevent ads from loading. Whilst the page is loading, ad blockers identify ad slots and hide the creatives. As a result, the end placements remain blank, so the user doesn’t even know where the ads were supposed to be. However, for an ad network, these ads are still counted as served impressions and the advertisers still have to pay for it.
- An impression is generated by a bot. Bots are special programs that imitate online human presence. These programs can download and refresh pages, scroll, click, and engage with the site contents just like real visitors. It is not often so easy to detect bots and many ad networks count bot traffic as real users. Consequently, the impressions served for such non-human “visitors” are still counted as successful. Because bot traffic can significantly reduce viewability, advertising strategists are recommended to always incorporate fraud detection tools into their campaigns.
- An ad is counted as “served” because of fraud. While it is quite a common situation that ad impressions are generated by bot traffic, ad fraudsters can use other tricks, such as ad stacking or pixel stuffing. Ad stacking means placing ads in layers - one on the top of another and so on. As a result, only the top layer is visible to the user, but the impressions are counted for all of them. For pixel stuffing, 1x1 pixels are placed around the website as placements for ad creatives. These pixels are invisible to the user when the page loads, but for ad networks, these are still “impressions served”.
- The user left before seeing an ad. One of the most common scenarios for low ad viewability is when the impression is counted even though the user left the page before an ad was loaded. This is confirmed by the numbers - 40% visitors close the page which loads more than 3 seconds. Another common situation is when the user opens multiple tabs or continues browsing other programs while an ad is served - these impressions are still counted too.
- Other non-human traffic. Apart from fraudulent bots, there are many other technologies that are able to generate impressions without human presence. These include web crawlers, download managers, spiders, link checkers, web-directories. Most of them usually have another purpose, but oftentimes due to their activity ad impressions are served and counted as successful.
- Ads location prevents them from being seen. Sometimes an ad position simply doesn’t fit into the window dimension or makes it impossible to be loaded on certain types of devices. Another case is a “scrolling” or “below the fold” position of an ad which means that the user has to scroll down the page in order to see it. The viewability rates of such ads are significantly lower compared to ‘above the fold“ positioned ones.
As we can see, there are many cases when ad impressions appear invisible for the human eye, still, they are counted as served. They don’t only damage advertising revenues but result in distorted statistics which, in turn, could lead to incorrect decisions and strategies. Some of these reasons behind low ad viewability are hard to control, so perhaps a 100% viewability rate might not be the most realistic goal. There are, however, things we can impact in order to improve the situation - let us discuss these in detail.
How to increase ad viewability?
The reasons behind low digital ad viewability present a range of complex issues, most of which can be fixed only by a joint effort from both supply and demand sides. Here are some of the most common solutions that advertisers can turn to in the search for increased ad viewability:
1. Reduce ad latency.Slow page loading is an important factor as every extra loading second increases the probability that the user leaves. To reduce this time, first of all, publishers should check and optimize their sites (here you can find some tips from the IAB).
Advertisers, in turn, should consider the parameters of their creatives - remember, that the weight of an ad can significantly impact its loading time even if the webpage it appears on is perfectly optimized.
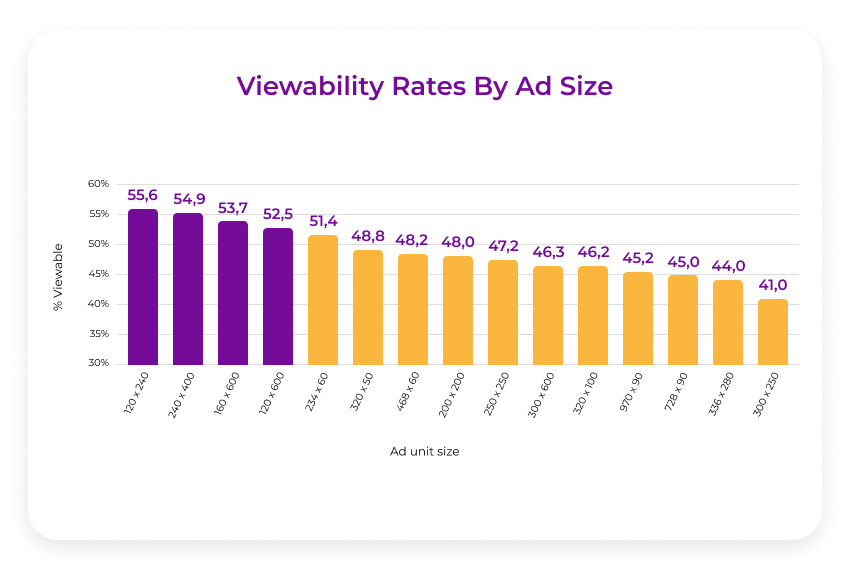
2. Consider the size and location of the ads. When it comes to ad location, a good practice for publishers is to inspect and reiterate their site design to find their ‘hot spots’ with the highest ad viewability rates. Above-the-fold ads are generally known to perform better than below-the-fold, but for the best results, it is essential to examine your specific website features and user behavior.
For advertisers, it is more important to consider ad sizes. When an ad is placed right above the fold, horizontal ads might work particularly well. Vertical ads, however, have higher viewability rates in general, especially if they are placed along with some relevant content. When creative’s size and location are optimized with consideration to viewability, advertising campaigns perform much better without additional effort.

3. Pay attention to ad fraud. Fraudsters can pose a significant threat to your viewability and ad budget, especially when it comes to ads with higher CPM. It is unlikely that the problem will be completely solved, but you can still reduce risks by taking simple precautions.
Make sure that you work with trusted vendors who provide viewability metrics and ensure system transparency and measurements. It is also important to review your campaign performance often and gather insights regarding the traffic and interactions with your ads. This information can be then used to adjust your campaigns timely and efficiently. A good DSP will usually provide you with both ad fraud detection tools and detailed reporting features.
SmartyAds approach to ad viewability
At SmartyAds, we believe that our partners deserve the best quality of impressions, which is why we do inventory fraud detecting and preventing. Thus, we charge advertisers for viewable impressions only. Our platforms have the latest ad fraud detection solutions inbuilt. This way we ensure sophisticated digital ad viewability coverage that corresponds to the top industry standards. These tools detect all kinds of suspicious activities, including bot traffic, domain spoofing, ad stacking, and pixel stuffing. At the end of the day, you get a real picture of your campaign performance and fake impressions don’t count.
SmartyAds viewability metrics allow our clients to get insights regarding user engagement with different types of ads, viewership data, as well as identification of real human views. This way advertisers can discover which ad placements and audiences provide the most value to their business.


